The Challenge of Mean Sea-Level Analysis
The analysis of monthly mean sea-level (MSL) time-series data from coastal stations presents a complex challenge, requiring the resolution of numerous superimposed periodic influences. While conventional harmonic analysis has established the foundational role of primary lunar and solar gravitational factors, significant variance often remains unexplained. This residual variance is frequently attributed to stochastic processes, although evidence suggests such processes may have little correlation with the structured, non-linear dynamics observable in the data.
A Deterministic Approach: LTE Modulation
This investigation moves beyond standard linear tidal models to examine the contribution of non-linear interactions. This section details the report's core thesis: that MSL variations are not random, but are driven by a set of deterministic, non-linear interactions between core astronomical cycles. This approach, based on Laplace's Tidal Equations (LTE), offers a highly parsimonious and effective model.
Core Concept: Astronomical Modulation
The model is built on the non-linear interaction between the annual solar cycle and key monthly lunar cycles.
The analytical framework adopted is the modulation approach derived from Laplace's Tidal Equations (LTE), as detailed by Pukite in Mathematical Geoenergy and associated online literature. This methodology, which also incorporates linear components, provides a structured mathematical basis for quantifying how the amplitude and phase of the shorter-term lunar cycles are systematically modulated by the longer-term annual solar cycle.
The application of this framework to monthly MSL data demonstrates a remarkable degree of parsimony, wherein a compact set of modulation terms derived from these fundamental astronomical periods accounts for a substantial portion of the observed variability. The resultant model fit underscores the high plausibility and descriptive efficacy of accounting for these non-linear interactions, revealing deterministic structure within what is often treated as residual noise.
Validation: Warnemunde, DE Case Study
To demonstrate the practical efficacy of the LTE modulation approach, this section presents a validation using the long-term MSL dataset from Warnemunde, Germany. This location provides a robust time series for resolving the complex interactions. The analysis yields a highly accurate descriptive model based on a concise set of deterministic factors.
Crucially, the model's predictive power and avoidance of overfitting are substantiated through rigorous cross-validation. The following interactive tabs show the model's high predictive accuracy on held-out data and the specific components identified by the analysis. Then analyze MSL data from the opposite point on the earth, at a coastal station in Honolulu and use the same hidden latent tidal layer to produce a cross-validation. Detrending and some short-term filtering was performed to isolate the salient interannual variability.
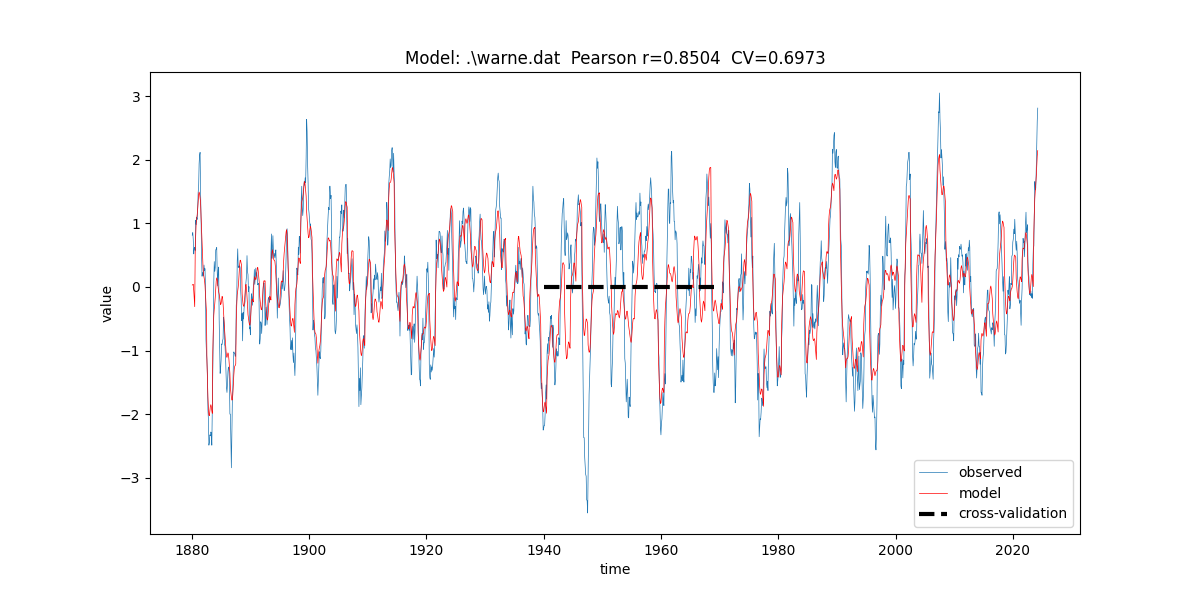
Warnemunde Cross-Validation Plot (1940-1970 Holdout)
This chart demonstrates the model's predictive power. The model (blue) was trained on data excluding the 1940-1970 period. It is then used to predict the values for that held-out period. The close alignment with the actual observed data (red) shows high predictive accuracy and a lack of overfitting.
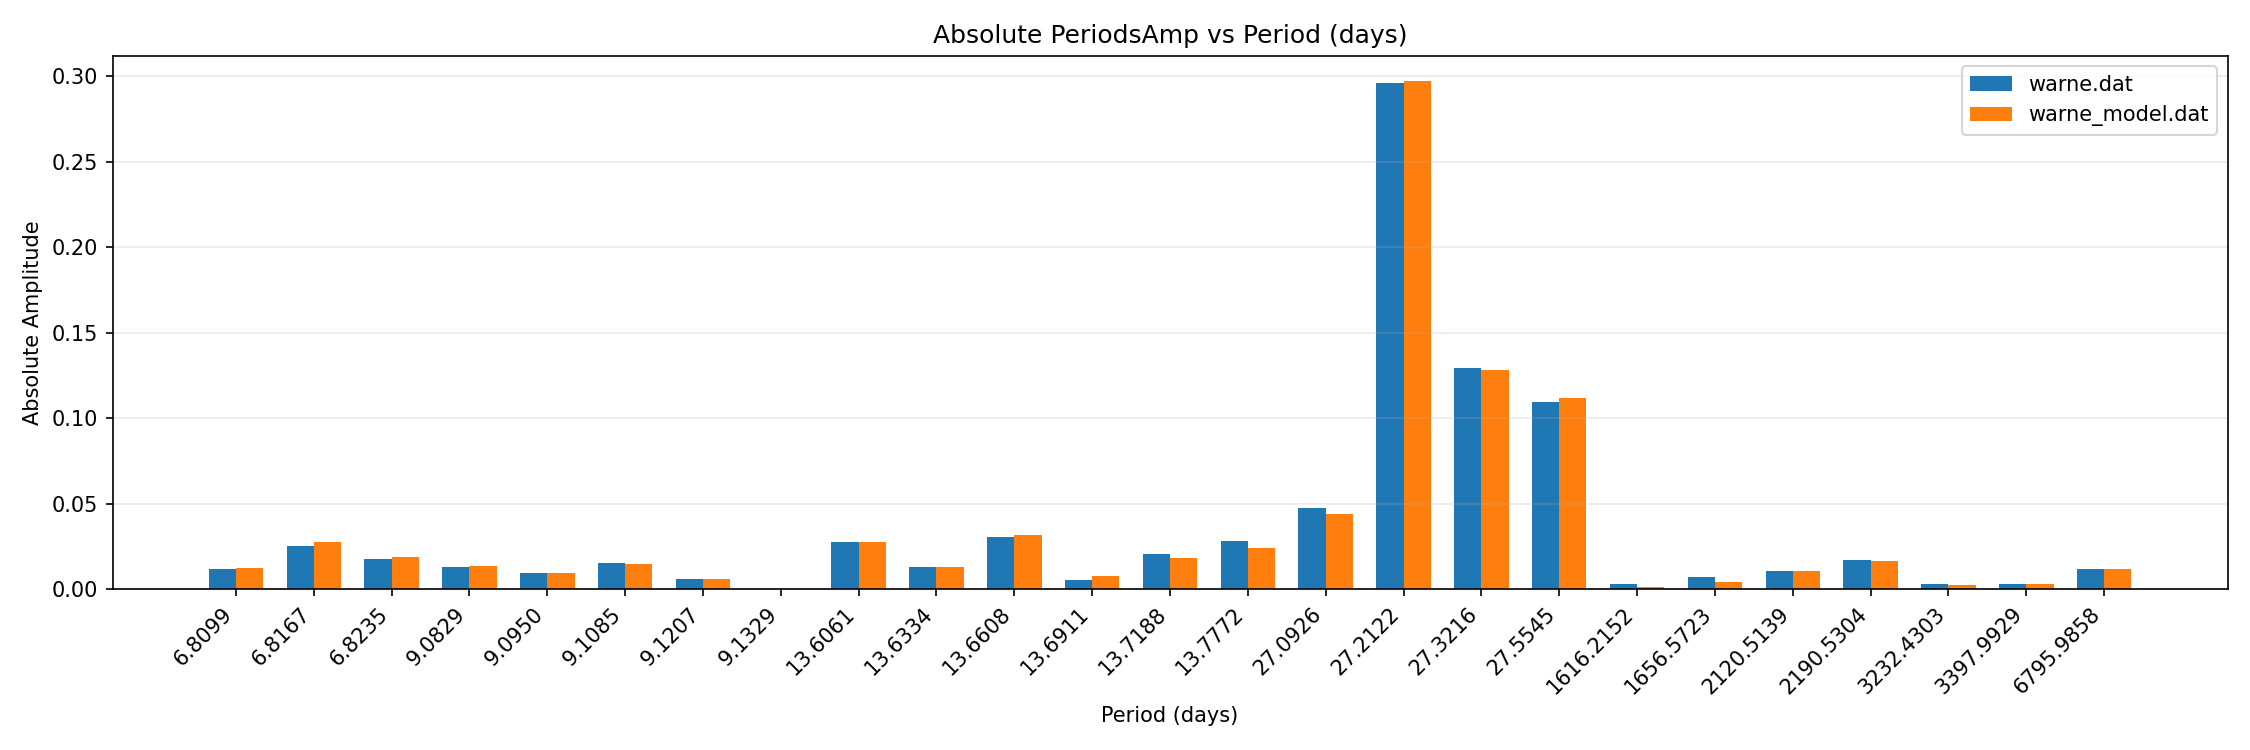
Warnemunde Model Component Plot (Bar)
This bar chart visualizes the amplitude or contribution of the different deterministic cycles (e.g., specific lunar harmonics and their modulations) that the model identified as significant components of the MSL signal.
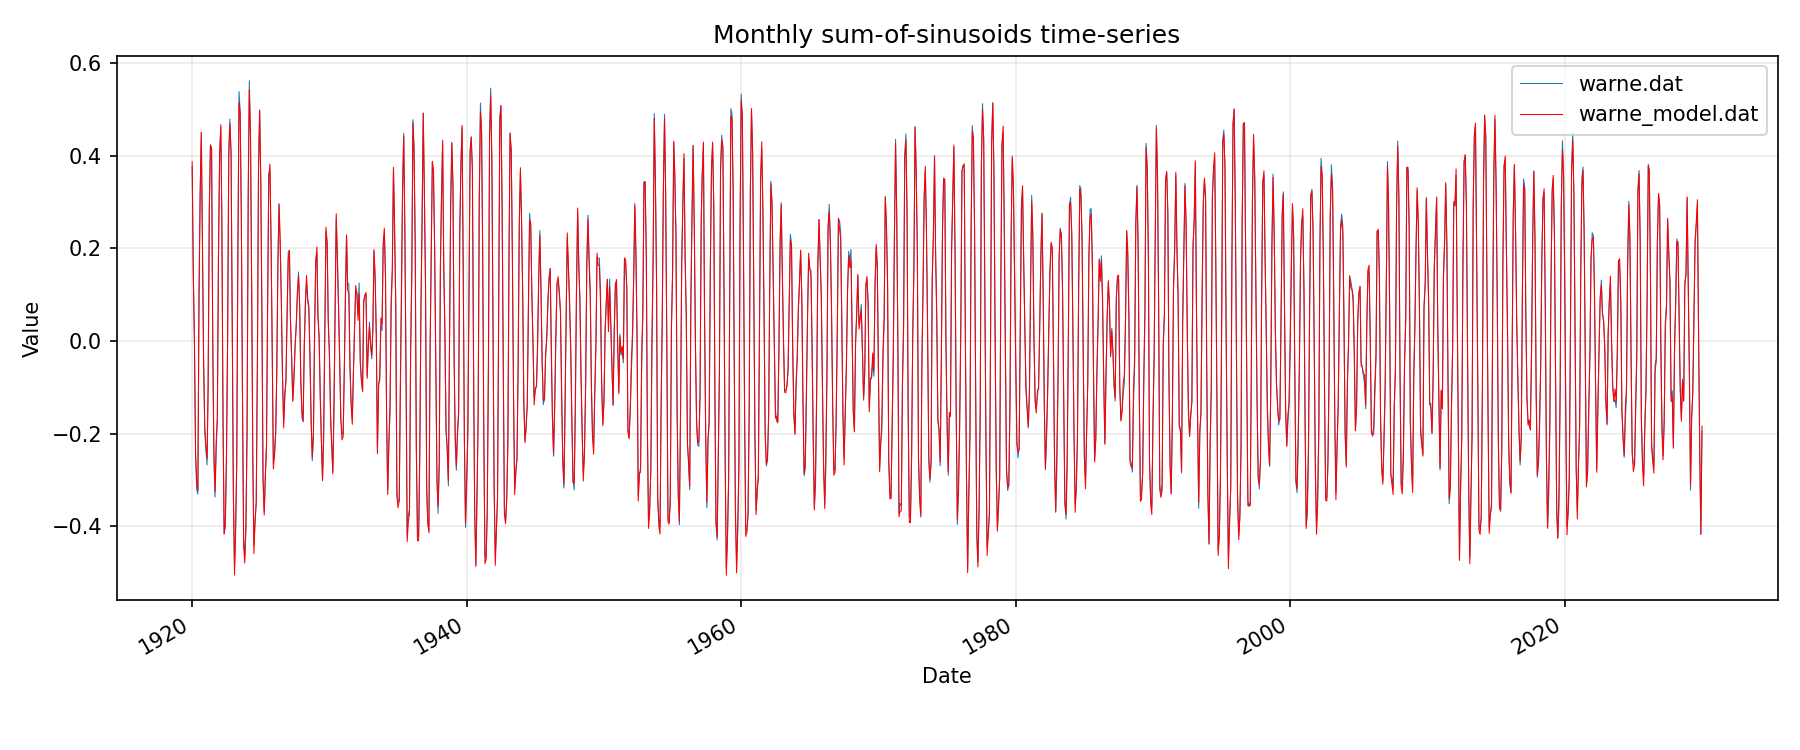
Warnemunde Model Component Plot (Sin)
This plot illustrates the phase or sinusoidal nature of the identified components, showing how they combine over time to produce the complex, observed MSL signal. These are analyzed on instantaneous monthly intervals so some aliasing is produced on the submonthly cycles.
Honolulu Cross-Validation Plot (1940-1970 Holdout)
This chart validates the model's predictive power. The model (blue) was trained on data excluding the 1940-1970 period. It is then used to predict the values for that held-out period. The close alignment with the actual observed data (red) shows high predictive accuracy and again a lack of overfitting. Recall that this used the Warnemunde model as a starting point, so the excluded interval is untainted as a form of spatial cross-validation

Honolulu Model Component Plot (Bar)
This bar chart visualizes the amplitude or contribution of the different deterministic cycles (e.g., specific lunar harmonics and their modulations) that the model identified as significant components of the MSL signal. Nothing significantly changes from the Warnemunde latent layer model.

Honolulu Model Component Plot (Sin)
This plot illustrates the phase or sinusoidal nature of the identified components, showing how they combine over time to produce the complex, observed MSL signal. Nothing significantly changes from the Warnemunde latent layer model.
