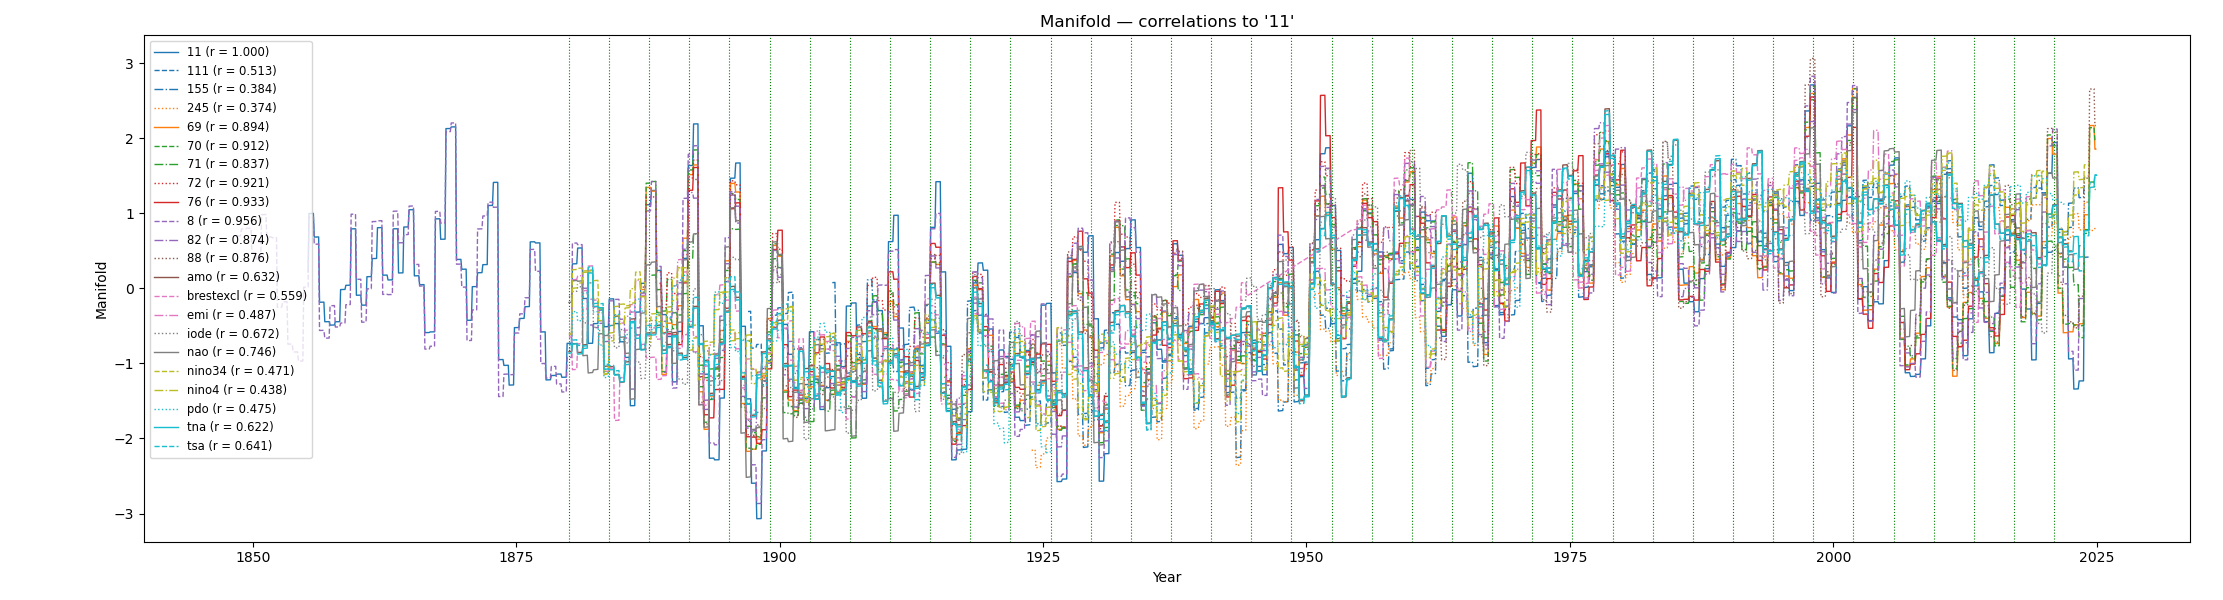
What is common: Latent forcing geometry
The manifold layer acts as a shared carrier structure. In that layer, otherwise different climate indices show strong similarity, implying that they are responding to a common organizing driver rather than to fully independent forcings.
All on same chart:
Grouped chart: 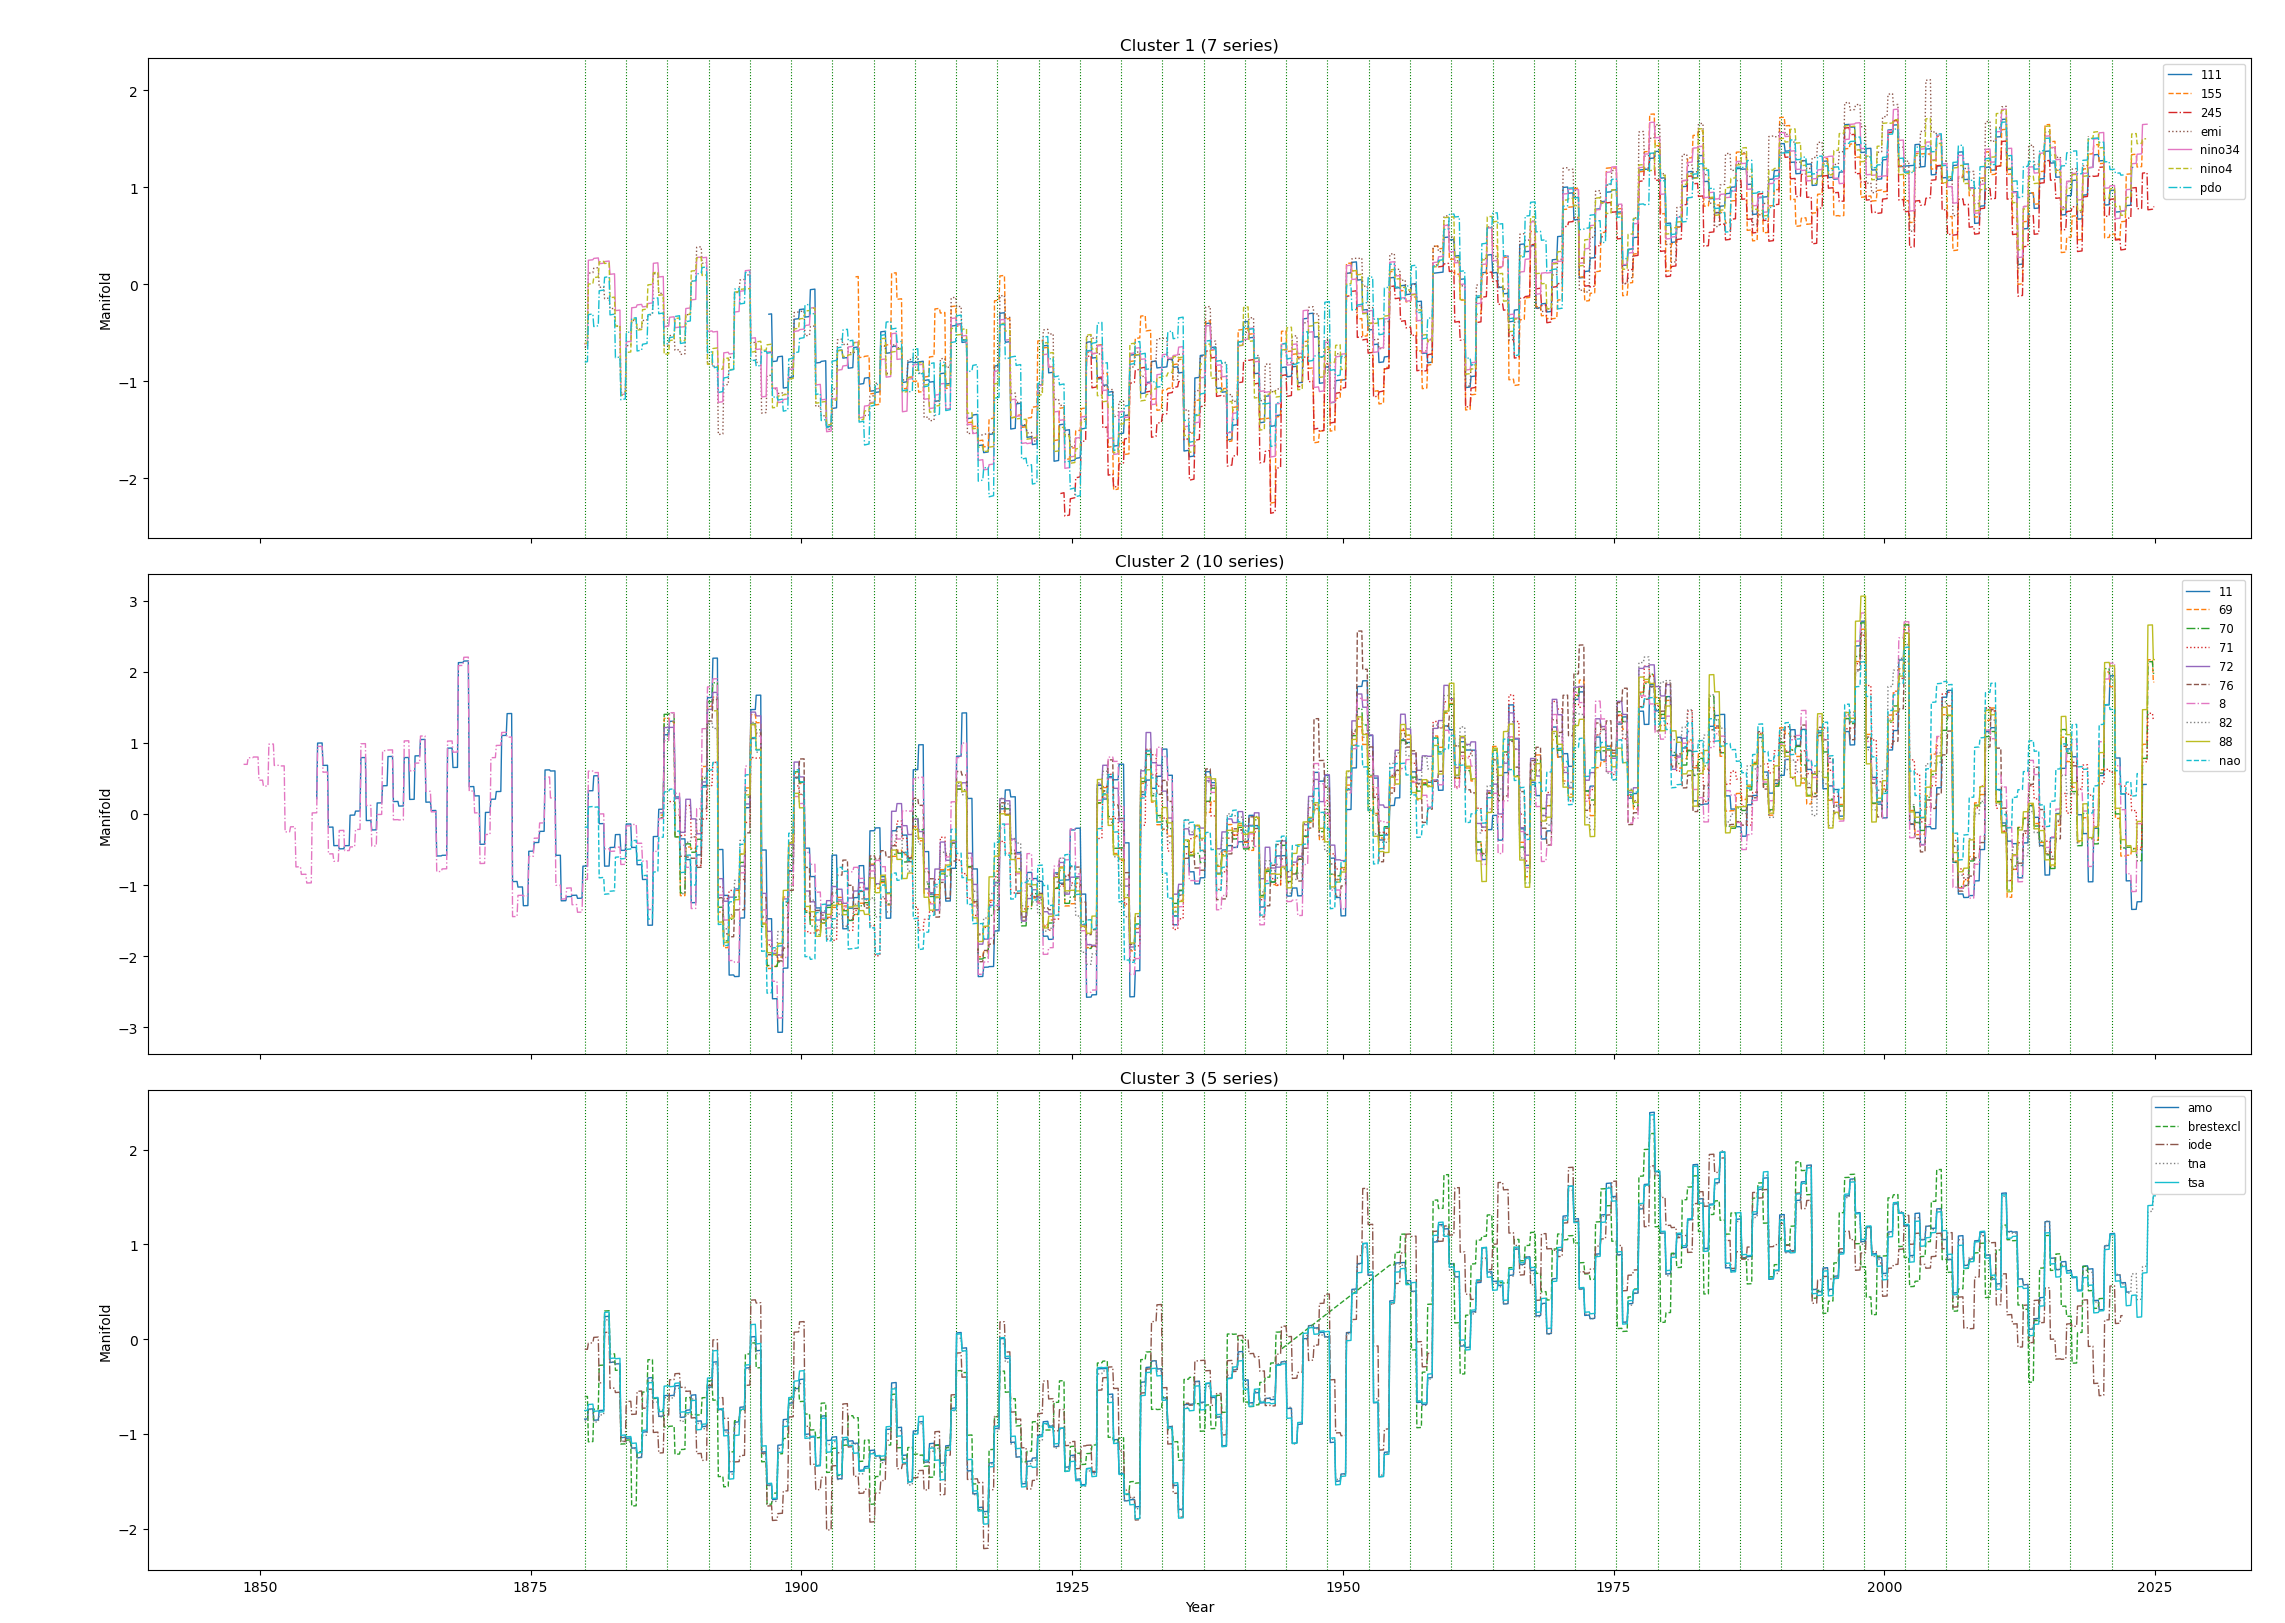
What differs: Local modulation
The final observable signals are weakly correlated because each index applies its own phase, amplitude, and harmonic modulation to the shared manifold. This local readout is what generates the familiar regional and modal distinctions.
Observed $index_i(t) \approx M_i\big(F(t)\big)$ , where F(t) is the common manifold coordinate and $M_i$ is the index-specific modulation map.
All sites modelled Can compare the manifolds individually against the others via this table:
| tsa | tna | pdo | nino4 | nino34 | nao | iode | emi | brestexcl | amo | 88 | 82 | 8 | 76 | 72 | 71 | 70 | 69 | 245 | 155 | 111 | 11 |
|---|
Click a cell to view the corresponding PNG.
The correlation matrix shows that oceanic indices across a wide range of scales share a common latent manifold structure, even when their final observable responses are mutually uncorrelated. This implies that the distinctive index patterns arise primarily through index-specific modulation of a common underlying forcing geometry. Although the final index responses are often weakly correlated, the correlation structure of the latent manifold layer is remarkably coherent across indices. This supports a framework in which a common forcing manifold is transformed by regional or mode-specific modulation into distinct observable patterns. Interpretation: High similarity in the latent layer points to a common dynamical scaffold. Low correlation in the final responses does not imply independent drivers. Observable differences can be generated by modulation acting on the same underlying phase manifold.